
Table of Contents
The see-saw market swings were reflected in cryptos, with the Israel-Iran conflict weighing on risk sentiment heavily. Clearly, this week's recovery in cryptos is just a temporary rebound from a sell-off in risk assets.
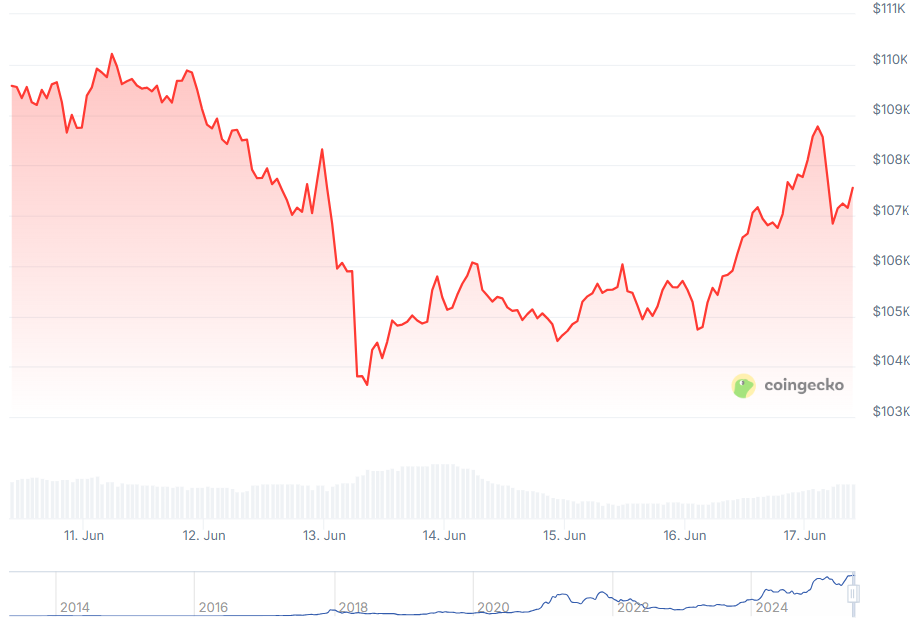
Bitcoin was last trading over $107,500 and has been swinging in the range between $100,000 and $110,000 over the past week or so.
BRN's bets that $100,000 acting as a floor for the OG token still holds good, with $110,000 working as a resistance level, and a breakout above that would lead Bitcoin to new life highs.
Right now, Bitcoin testing $110,000 seems a distant bet, with the OG token more likely to test its floor of $100,000.
President Donald Trump's recent comments and his early departure from the G7 summit in Canada suggest that the Israel-Iran conflict is unlikely to abate.
Compared to the sell-off in April after Trump's so-called Liberation Day tariffs on almost the entire world, the Middle East-led fall in risk assets has been somewhat controlled.
"Sell America" to "Buy America," Now?
There were murmurs of "Sell American Assets" turning into a "Buy American Assets" theme recently, barring the dollar, of course.
The US stock market is higher than the Liberation Day levels, credit spreads are falling, and bond yields have leveled out.
Even with a weakened dollar, we'll still accept it. Things will not be easy, though. Specifically, a combination of increased issuance pressure and the anticipated 4% inflation due to the Israel-Iran war drove crude prices higher.
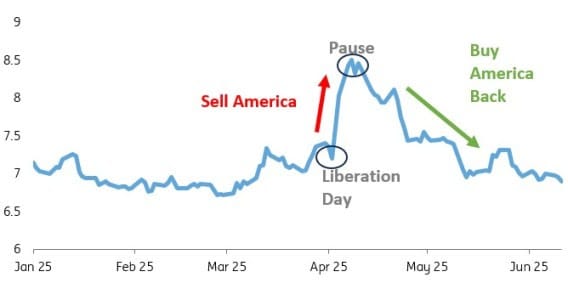
Before "Liberation Day" ever happened in April, the term "Sell America," at least for the week following Liberation Day, gained international attention.
Subsequently, the "Buy America Back" era began. A good analogy would be the reduction in the generic all-in high yield to below 7%. Yields above 8.5% were recorded on the day when tariff pauses were implemented.
The impact was felt particularly by cryptos, which do not have a direct impact from tariffs, so to speak.
The stock markets have a similar pattern. The S&P 500 is up 20% from its post-Liberation Day low and 7% from its pre-April 2 level.
Unfortunately, the currency is still dragging down the Buy America Back story, and we're not oblivious to that. The US stock market is also not looking good for 2025, particularly when compared to other currencies. Nonetheless, the change has been dramatic.
Based on the current state of the stock market, we may explain the previous crash after Liberation Day by reducing the projected flow of future profits, on the assumption that tariffs were an ineffective tax wedge.
Indeed, there was a hint that valuations might struggle to revert to their initial state, a logical conclusion given its apparent simplicity.
The next issue is how to value the ensuing rebound, now that stock market indices are well above their levels before Liberation Day.
The same reasoning, that future earnings are better now, surely can't be used here. Tariffs are still in effect, and we assume this won't change soon.
Cryptos & Gold
Why are cryptos singing the same tune as stocks, when not too long ago, they were rising in sync with gold.
Clearly, the Federal Reserve being forced to stay on the sidelines and keep rates on hold is a narrative weighing on cryptos more than other assets at this point.
Often regarded as the financial markets' "deep thinker," the bond market may hold some clues.
A degree of material quiet is seen in the bond markets.
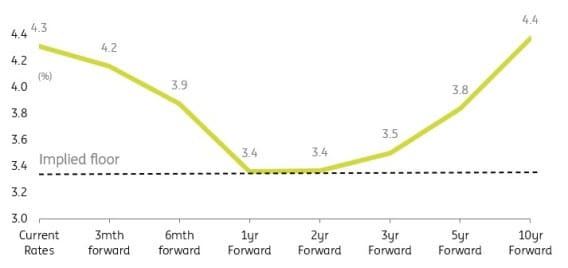
On the day the tariffs were halted, the 10-year Treasury yield reached a high of 4.6%. Despite some tremors, it has recovered and is now back in the 4.4% range.
There was respectable demand at the most recent 30- and 10-year auctions, which is likely related to the recent tame inflation statistics and increases in unemployment claims.
Additionally, the market discount for the Fed funds rate is reassuring and constructive, reflecting 100 basis points of cuts discounted.
This is encouraging news because the forwards market is pricing in a bottoming out around neutral and a subsequent trend of rates gradually rising again.
Fed Funds Futures
But cryptos are telling us a more compelling story from the Middle East war perspective.The Fed will be compelled to remain steadfast and refrain from any further actions this year..
With the war still ongoing ahead of the Fed's meeting, the language of the policymakers on tariffs and the impact of the war will be parsed to understand the rate path.
While crypto's behavior is not entirely skewed, one thing is clear: digital assets have a long way to go before cementing their place as an alternative store of value ahead of gold.
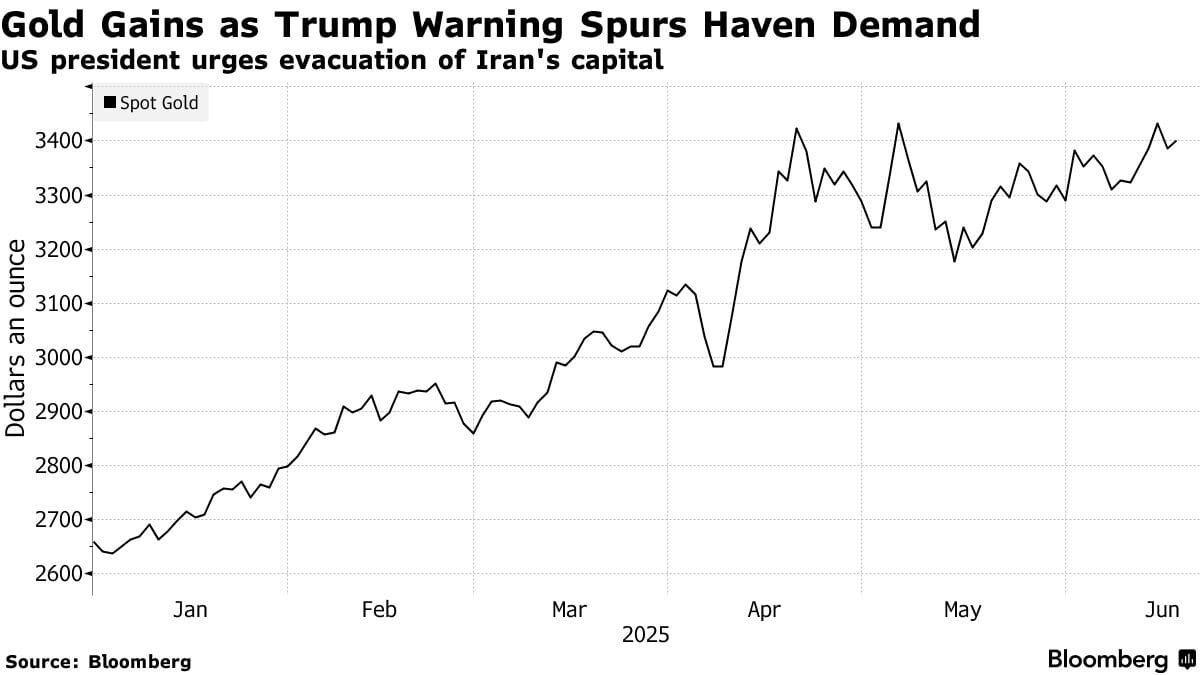
The yellow metal, true to its safe-haven status, is gaining more traction driven by geopolitics. Bullion is strongly running up towards its all-time high, and another week of the war would see it breach those levels comfortably.
While gold fell on Monday to mark its worst single-day decline in a month, bets are for the precious metal to gain if the US jumps into the war, which seems more and more likely.
What Crypto Technicals Say
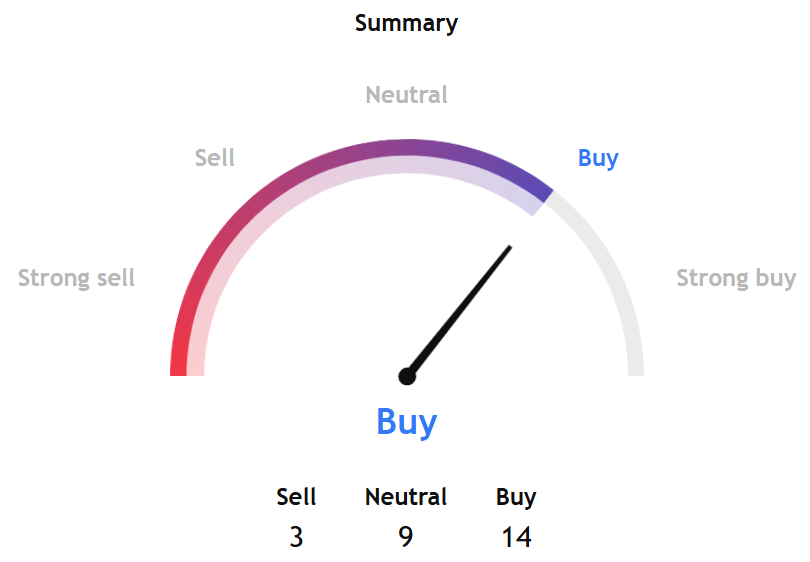
TradingView's BTCUSD technical analysis, which is based on the most prominent technical indicators, including moving averages, oscillators, and pivots, for the week ahead showed a buy signal.
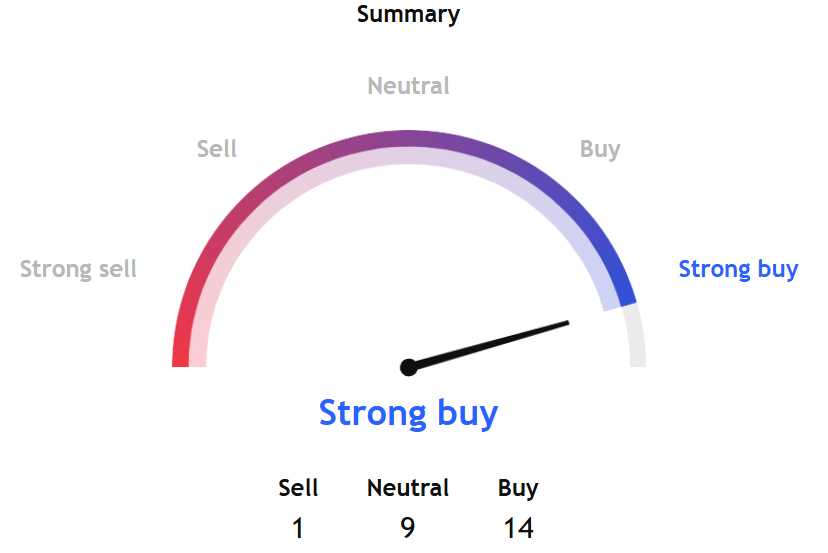
For the month ahead, the technical analysis points to a 'strong buy' bet.
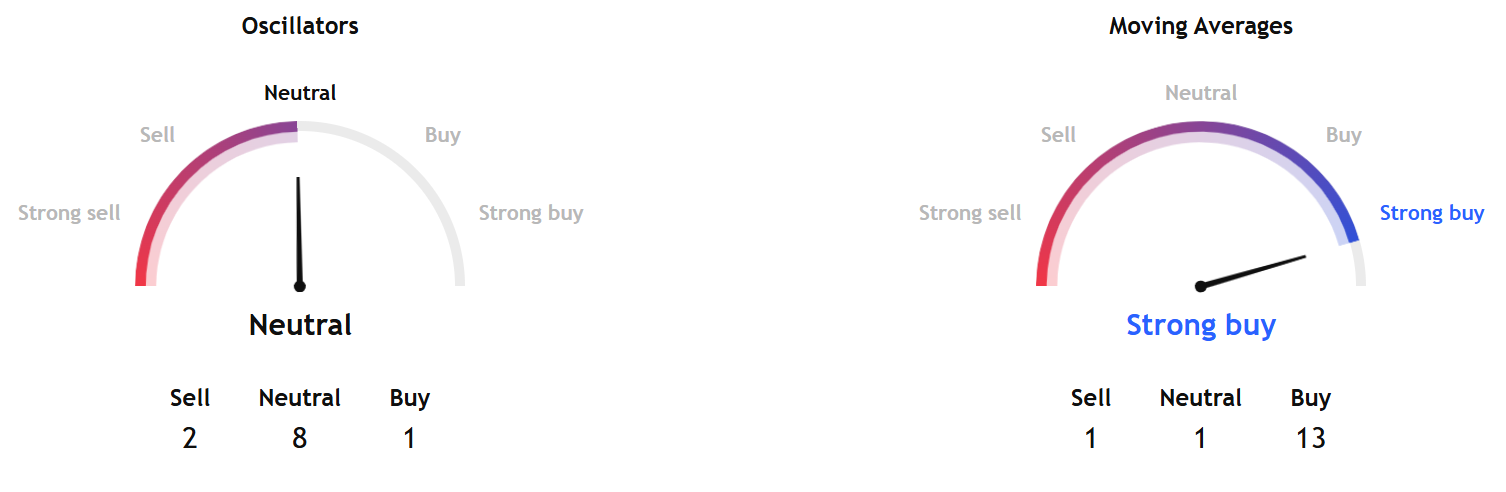
A further analysis of oscillator indicators for the week ahead shows a neutral status, while moving averages point to a strong buy signal. Within the oscillators analysis, the Momentum (10) gauge and Stochastic RSI Fast (3, 3, 14, 14) gave a sell signal.
Within the moving averages analysis, the Hull Moving Average (9) gauge pointed to sell.
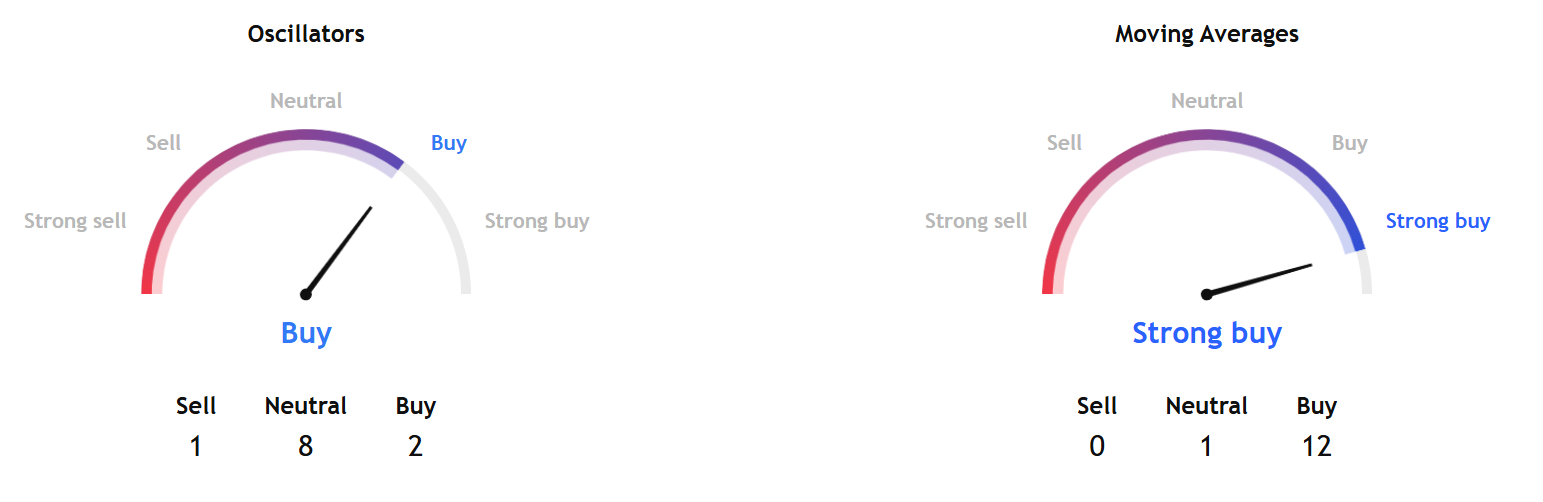
For the month ahead, the oscillator indicators point to a neutral status, and moving averages signal a strong buy status.
Within the oscillators analysis, the Commodity Channel Index (20) gauge showed a sell signal for the month ahead, while all moving average indicators showed either a neutral or buy status.
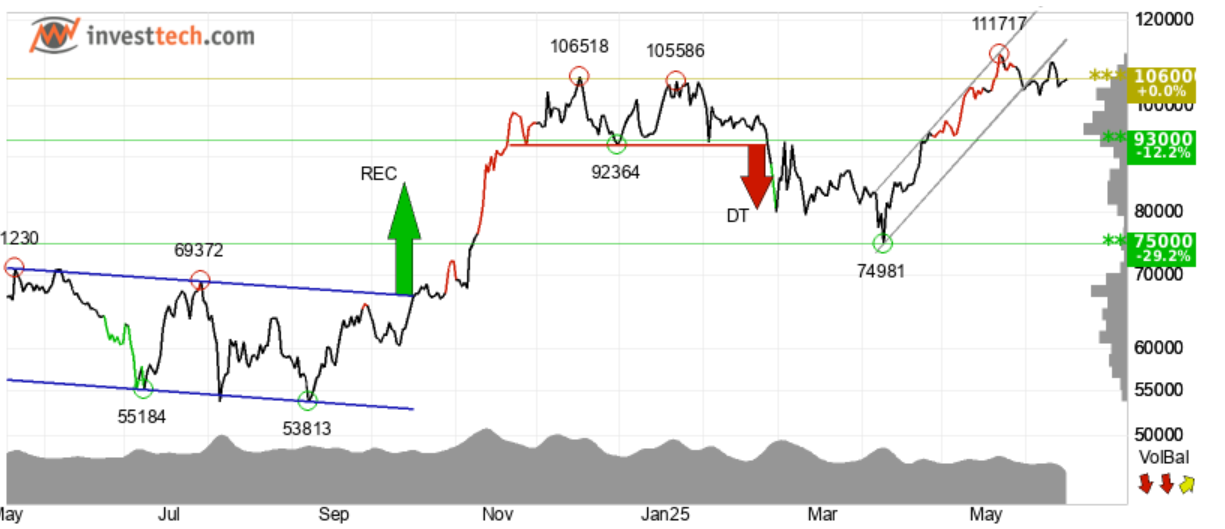
InvestTech's algorithmic analysis shows "hold" for Bitcoin, with the short-term and medium-term scores pointing to that strategy.
In the short term, Bitcoin's price shows a more gradual increase in speed or the beginning of a more horizontal trend. Support and resistance levels for the currency are $102,400 and $110,000, respectively. The negative volume balance has a short-term depreciating effect on the token.
In the near future, the crypto is considered to be technically neutral.
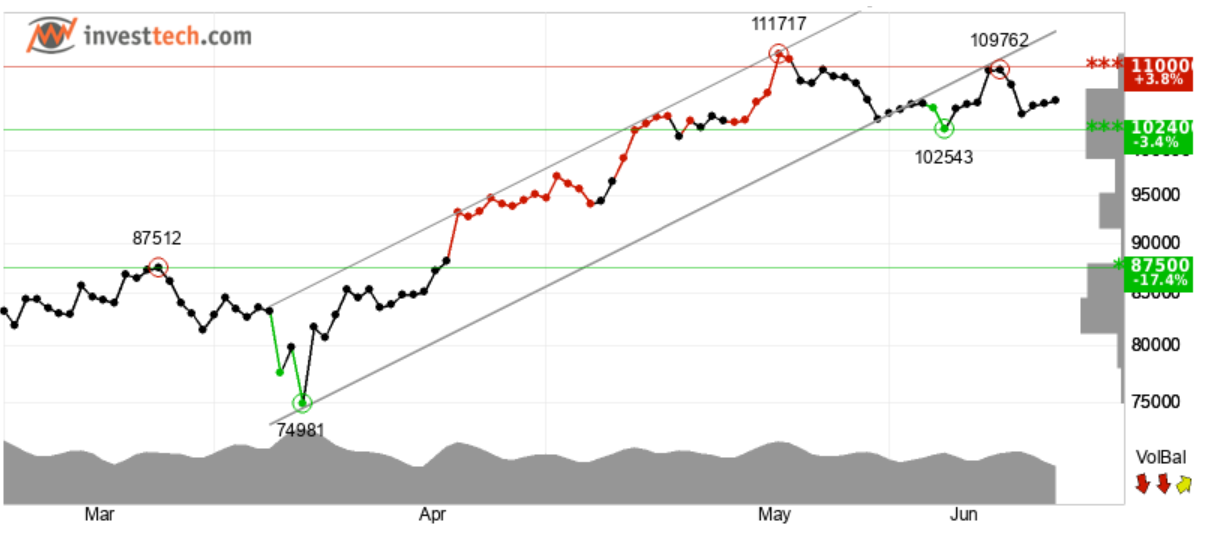
Bitcoin's price action of $106,000 provides medium-term resistance for the crypto. A downward break of $106,000 indicates a negative reaction, whereas an upward break of $105,000 indicates a positive signal.
If the volume is negative, then more people are buying on days when prices are decreasing than when prices are rising. This suggests that investors are becoming less optimistic.
There is a potential for a downward reaction when the RSI diverges negatively from the price. For the medium to long term, the token is considered technically neutral.
SoSoValue's US BTC ETF Options shows the Daily Total Net OI (Delta) pegged at -544.34 million.
The Daily Total Net Open Interest (Delta) shows the difference between the daily movements of open contracts for calls and puts.
When the number of open contracts for Calls rises, it could mean that market makers are hedging their positions with more underlying assets, which usually means more ETFs.
On the contrary, more open contracts for puts indicate that market makers will have to sell assets to cover their holdings, which means more ETFs will be sold.
This metric is useful for learning about market dynamics and the strategies used by market makers to mitigate risk.
SoSoValue is a research platform driven by AI, and the analysis of derivative bets currently points to more ETFs likely to be sold to cover investors' holdings.
Overall, technical analysis points to an uninspiring hold or neutral pattern for Bitcoin this week. Of course, a reversal or a truce between Israel and Iran is likely to boost risk assets and cryptos.
However, that looks more unlikely at the moment.


