

Table of Contents
Bitcoin (BTC) pumped by 9% over the past 24 hours, Yet, it failed to break the $68K resistance with the selling pressure stalling the bullish rebound. Earlier, BTC fell below $70K, touching a 10-day low of $60.9K before recovering over the past day.
Will bulls be able to rally the buying pressure to cross the $68K hurdle and target another all-time high record?
 Blockhead
Where's Bitcoin’s Liquidity?
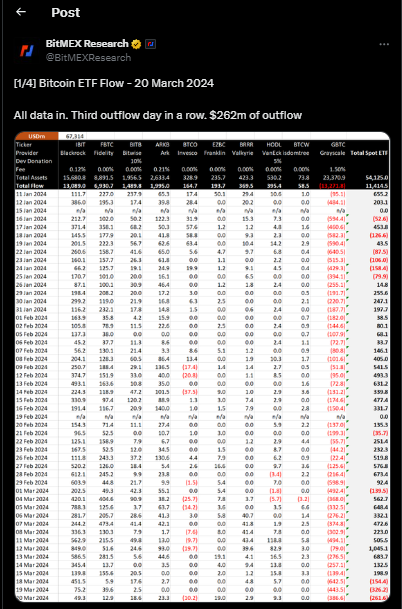
Data from BitMEX Research showed that Bitcoin ETFs experienced a third day of outflows in a row with $262 million recorded in net outflows. With the much anticipated Bitcoin halving still 30 days away, the outflows hinted at price consolidation moves by investors.
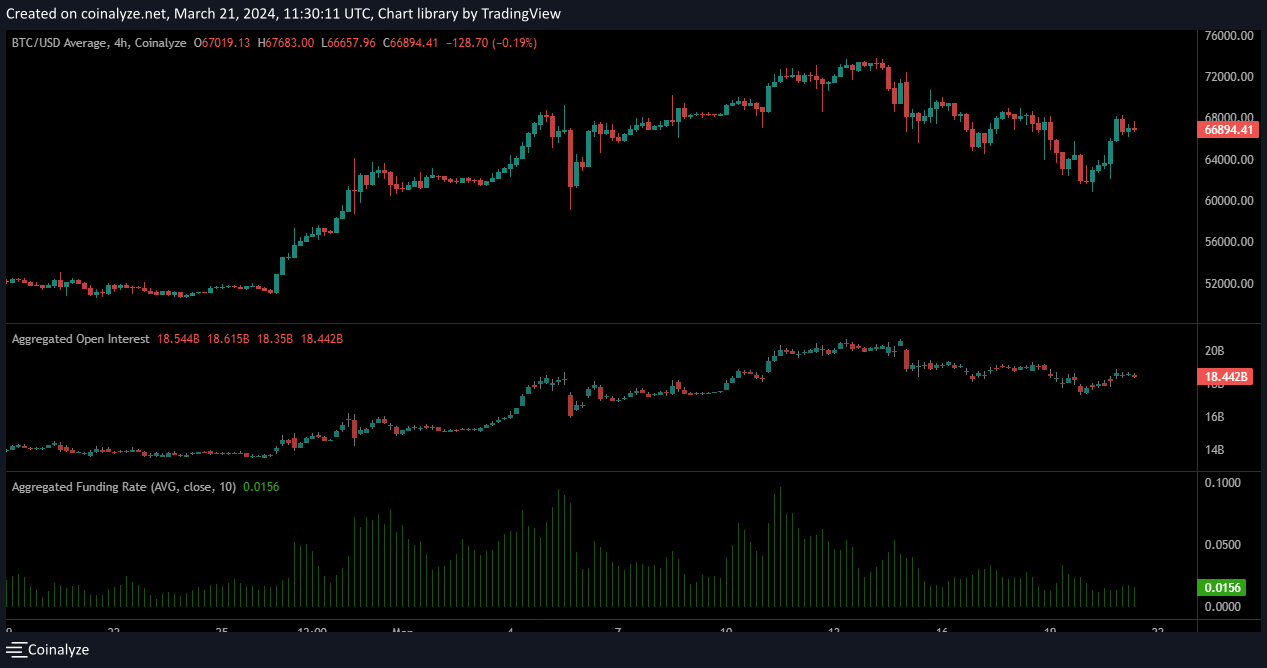
Despite the outflows on Bitcoin ETFs, traders in the futures market continued to bet big on BTC going on another bullish run. Open Interest (OI) data from Coinalyze showed a 2.33% rise over the past 24 hours. This took the total Open Interest on Bitcoin to $18.4 billion.
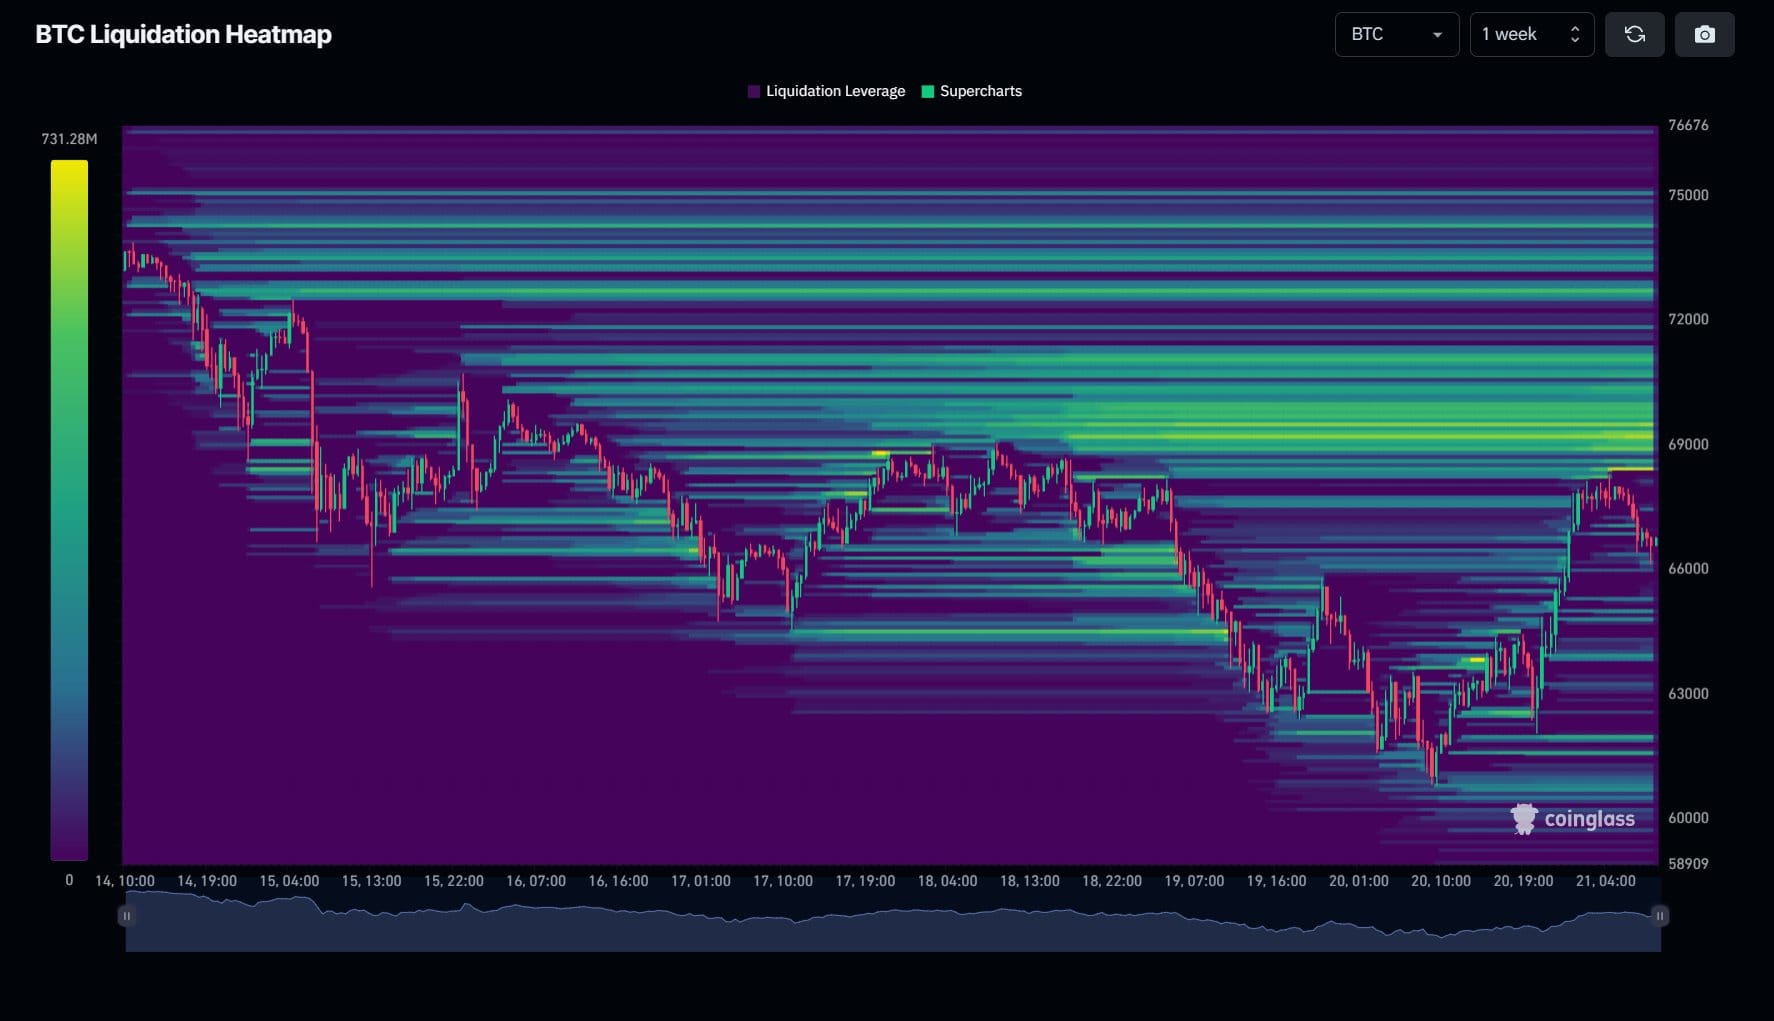
Conversely, a look at the liquidation heatmap on Coinglass showed that over $4 million worth of short positions were in danger of being liquidated if BTC crosses the $70K mark.
This selling pressure could slow down Bitcoin’s price recovery, despite the market consensus about BTC still remaining bullish.
Can Buyers Scale $68K?
The four-hour price chart showed a dwindle in BTC’s capital inflows into spot markets. Even though the Chaikin Money Flow (CMF) remained above zero, it dipped from +0.07 to +0.02.
Similarly, the Relative Strength Index (RSI) peaked at the neutral 50 zone to further highlight the reduction in the short term buying pressure.
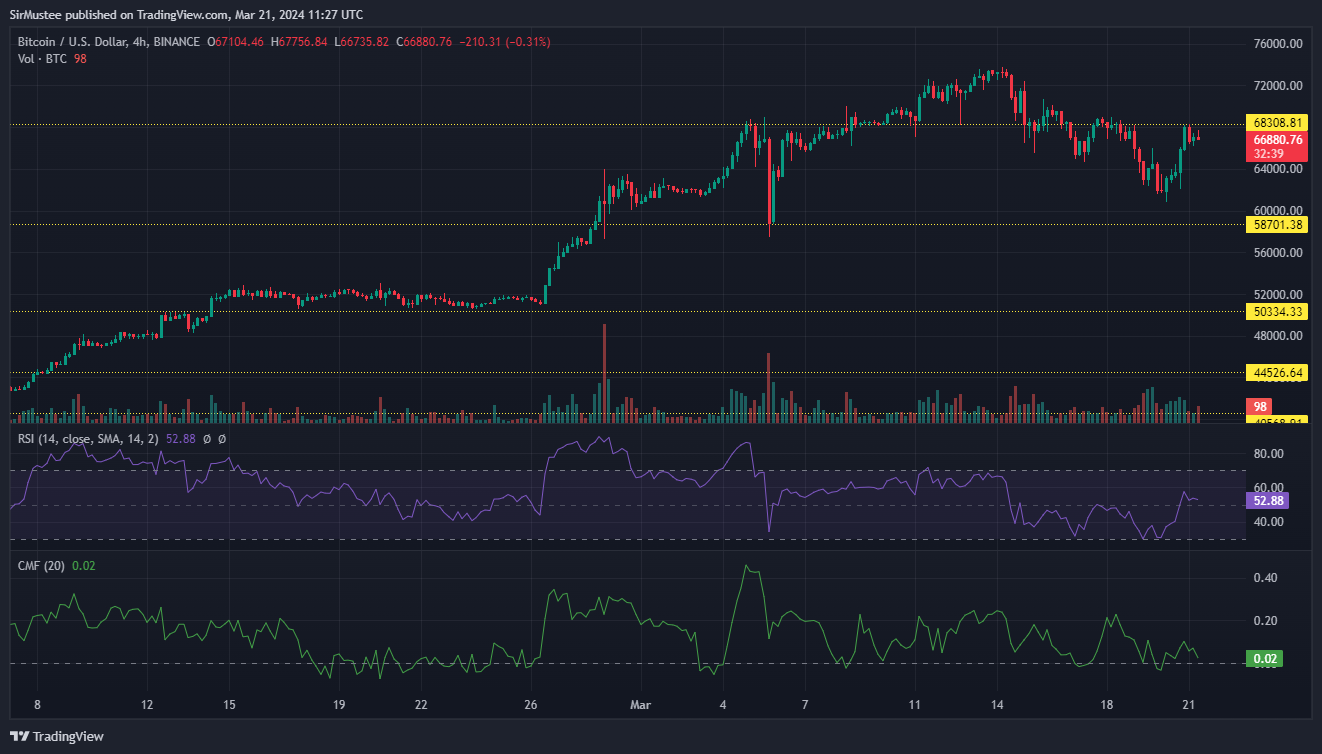
This presents two scenarios for BTC: the first scenario involves another retest of the $68.3k resistance level. If buyers fail again, BTC could potentially dip to $64k.
On the flip side, if buyers break through the sell resistance at $68.3k, BTC would touch $70k again and could easily go on to set a new all-time-high.
Disclaimer: This article does not constitute trading, investment, financial, or other types of advice. It is solely the writer’s opinion. Please conduct your due diligence before making any trading or investment decisions.


