
Table of Contents
The growth of Ethereum over the past week – the coin has climbed some 40% in the past 7 days to reach US$1,513 currently, according to CoinMarketCap data – has provided the crypto space some much-needed optimism amid a bleak few months.
Bitcoin has similarly grown, though only by around 15%. The simple reason put across by most observers is this is due to news about Ethereum’s long-awaited “Merge”, which has now been given a tentative date of September 19. This shift will significantly improve the blockchain’s scalability and reduce the network’s overall carbon footprint.
Read more: Ethereum’s Ropsten Testnet Completes “Merge” to Proof-of-Stake
But is Ethereum’s recent rally just a sentiment-driven one that driving a feedback loop of “buy the news”?
Since XET data started in February 2018 the correlation with XBT is just below 93%. In other words the two series track each other almost perfectly. This means that with 1,620 data points to lean on, it’s unreasonable to assume they decouple in a meaningful way. They dance to the same tune more or less.
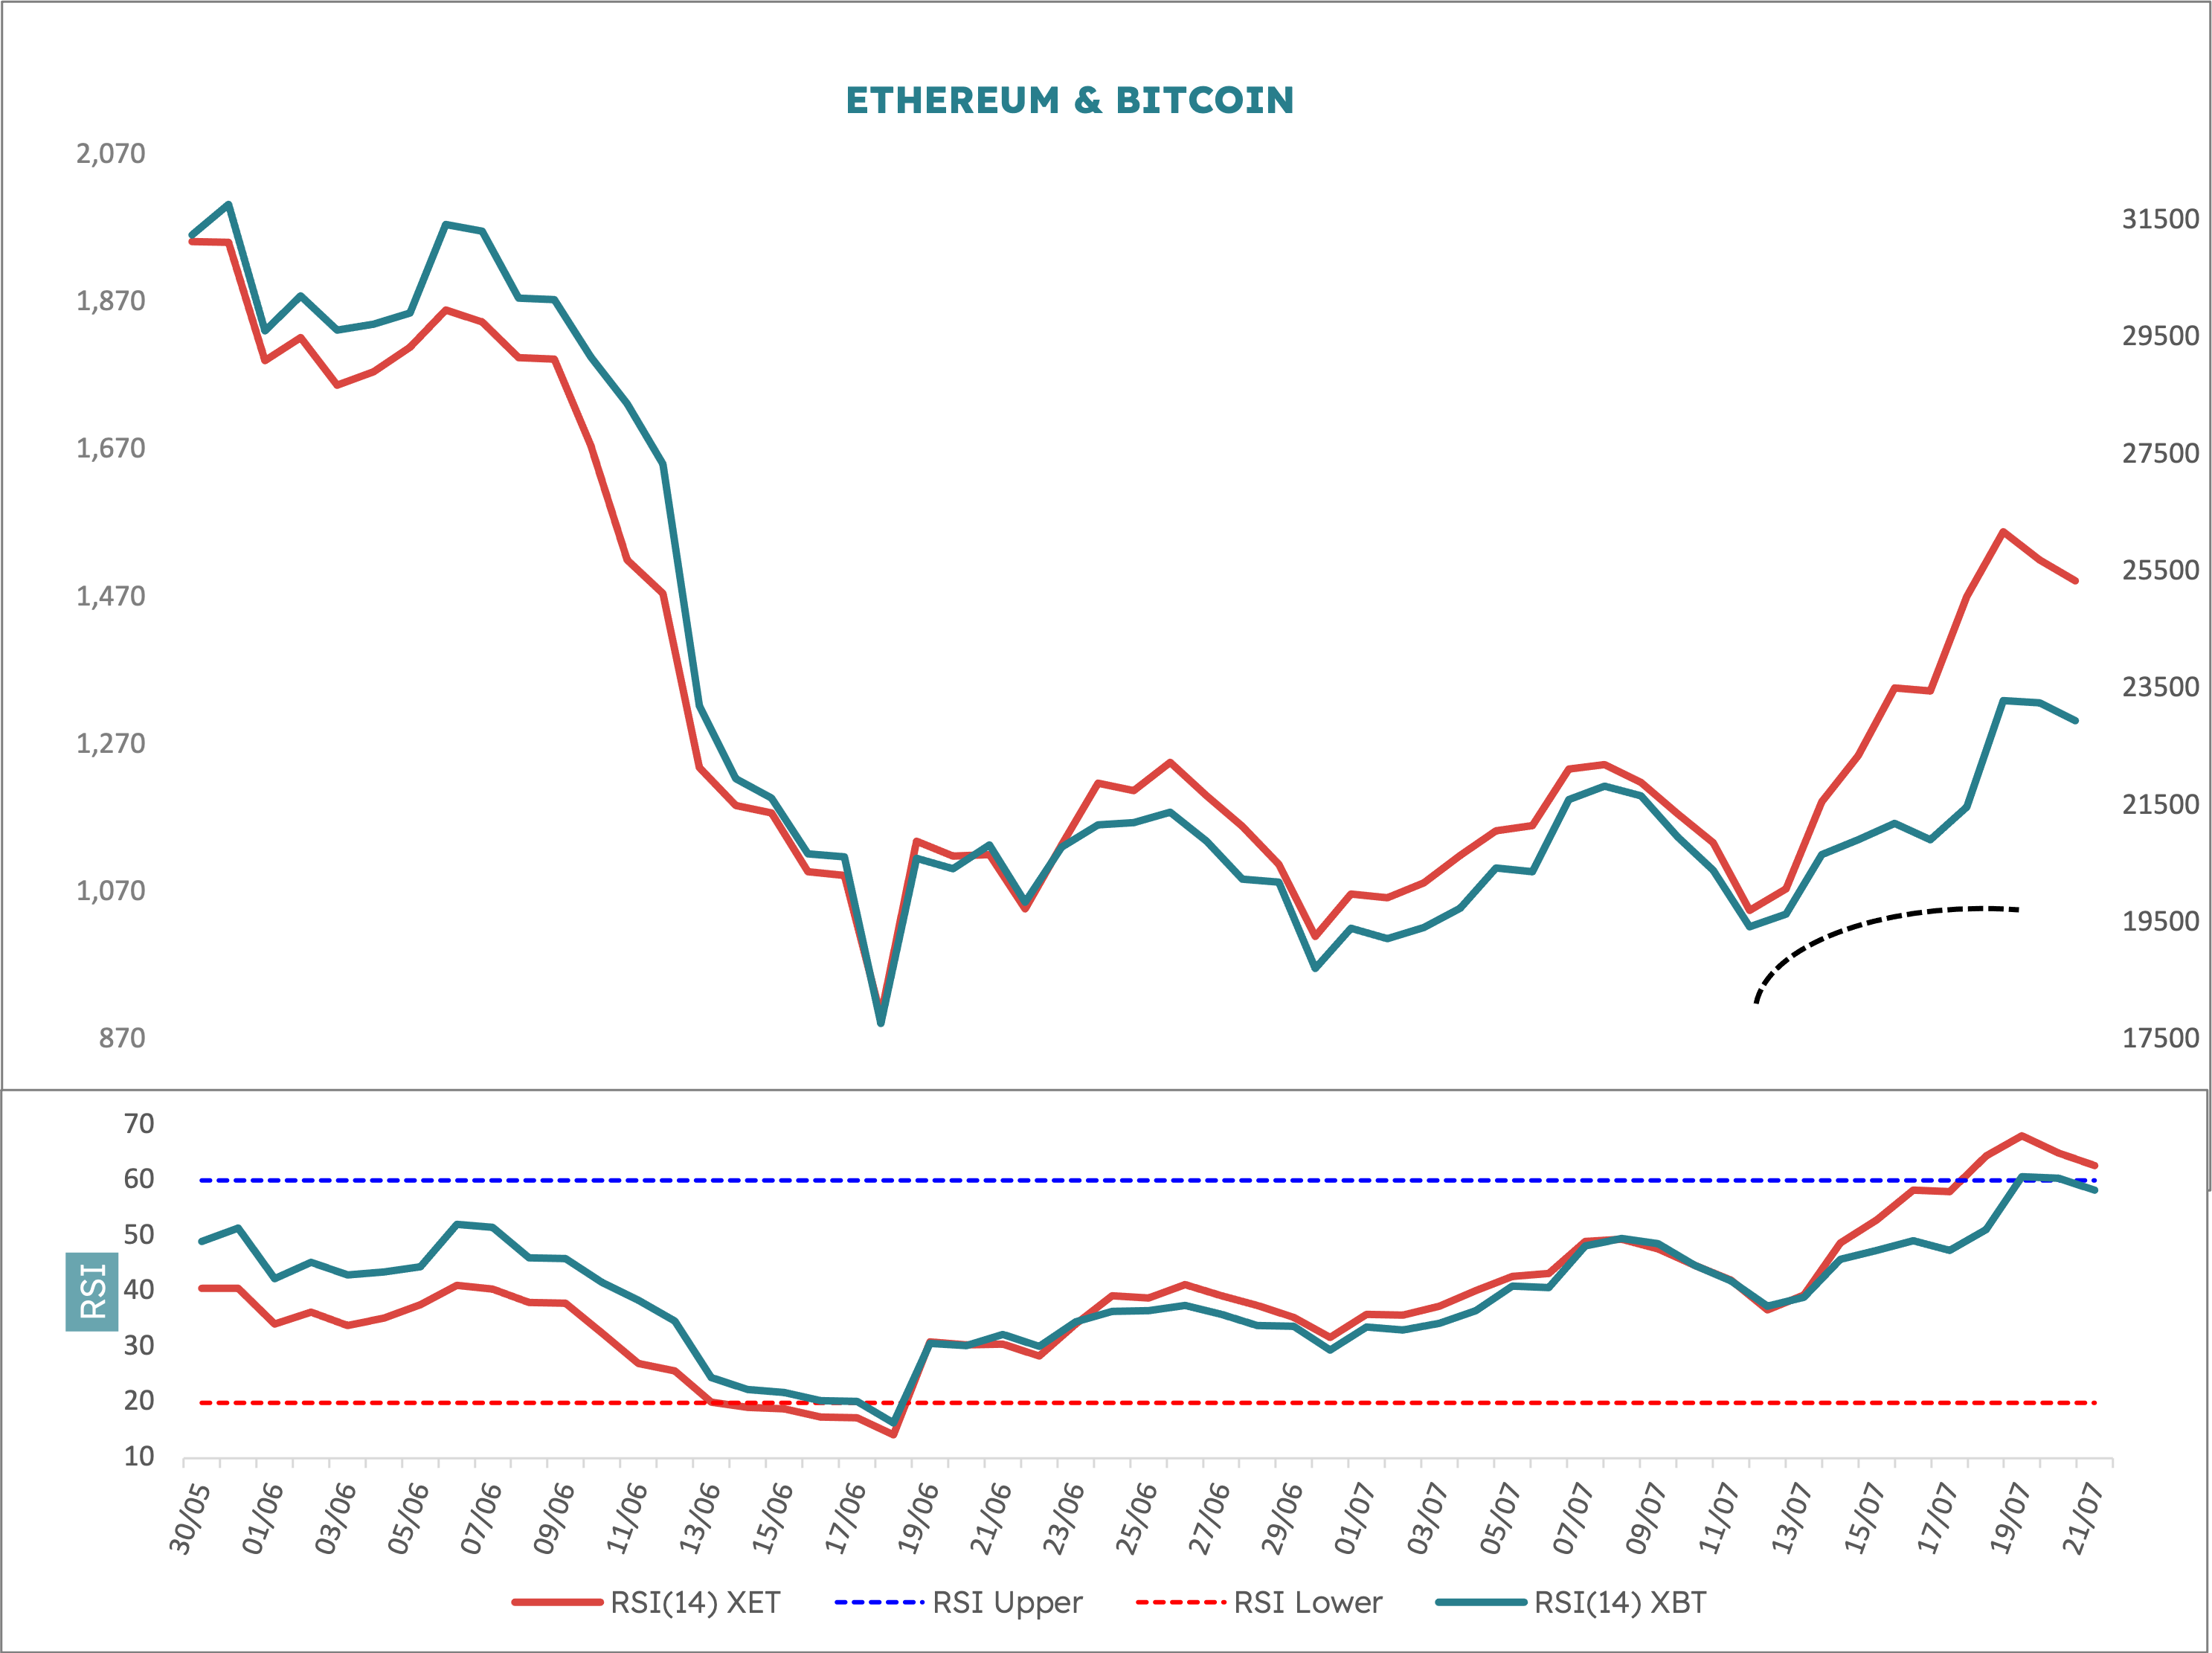
The spread between the two series reflected by XETXBT, which has averaged 4.45% over the sample and the standard deviation is 2.12%. The spread blew out to a wide 6.85% on 18 July, but this in fact is just about only a one standard deviation excursion. In fact, XETXBT has spent 22% of its time above that 18 July level. So all told, it’s unusual but its not mindbendingly unusual. And at the time of writing (21 July 2022) the spread as pulled back to 6.4% from the high a few days ago.
What we have here is a fundamental price shock and this can be expressed simply in cycles terms. I have plotted one and a bit rotations of the 20 day cycle on the chart. This cycle is regular and common in pretty much all financial data series. The 20 days bit is the period of the cycle, which is the trough to next trough time duration. Sometimes it’s a little longer, sometimes a little shorter, but the long-term average is 20 days – it’s a fixed like clockwork cycle in markets. I will write a study notes piece on cycles analysis soon, but if you can’t wait, go to Amazon and purchase Mastering Hurst Cycle Analysis by me.
The other element to cycles is amplitude, this is the height or power of the cycle. This can fluctuate and can be a function of a few different things. It can blow out if longer cycles are powering up (and these longer cycles are also regular) but it can also blow out if there is a fundamental shock: some unexpected good news or favourable shift in sentiment for example.
In this case, once the news is fully discounted, the amplitude tends to normalise (which would be XETXBT mean reverts). What doesn’t change is the cycle period, this remains the same regardless.


