Table of Contents

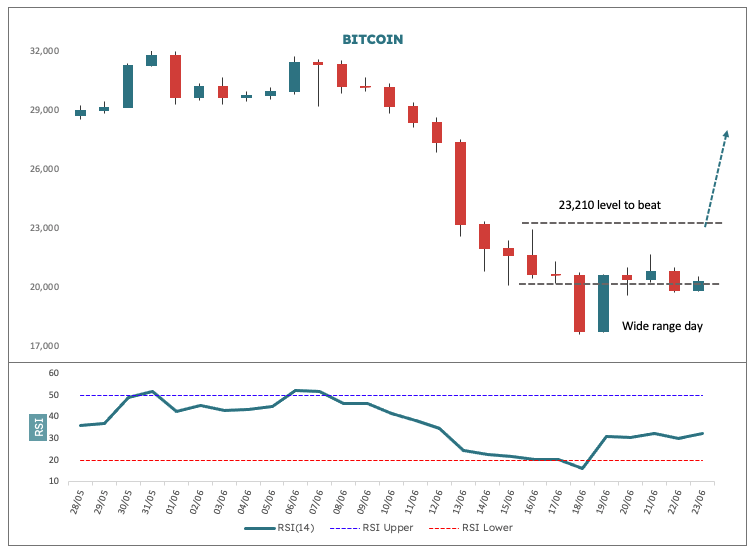
In the commentary yesterday we looked at the apparent capitulation low for Bitcoin that was posted over the weekend and noted that it probably marked the 20-week cycle low. The upshot therefore was the anticipation of a decent rally with a target of US$33,000 by say August. It’s price has drifted lower and now is testing the bottom of the potential base we would expect to see.
What I thought would be interesting is to assess what happens after a very wide range up day. This is simply a session where the close is substantially higher than the open and results in a long white candle, such as we see on Sunday 19 June. For Ethereum, this was a 26.3% intra session move and for Bitcoin it was 15.9%. Ethereum is more volatile and is expected to post a larger value.
The table below shows what happens for the largest 13 intraday moves in percentage terms (going back to the start of 2019). The test is for close to close price change over 1, 5, 10 and 20 days after the wide range day. I have divided this into two sections: All signals and only those signals that occur in a low market (sub 50 in RSI terms the day before the signal).

There are 13 signals for all and 6 for below 50 RSI. Just focusing on Bitcoin now, the takeaway is that after the signal and below 50 RSI (Sunday’s day before RSI was 16.3) the test shows that the first day is weak, but after 5 days we return an average 2.6%, after 10 days 6% and at 20 days 16%. Thus, the test shows, albeit with limited data that we can expect positive returns from here.


