Table of Contents
A slew of notable technical events occurred in Bitcoin over the weekend.
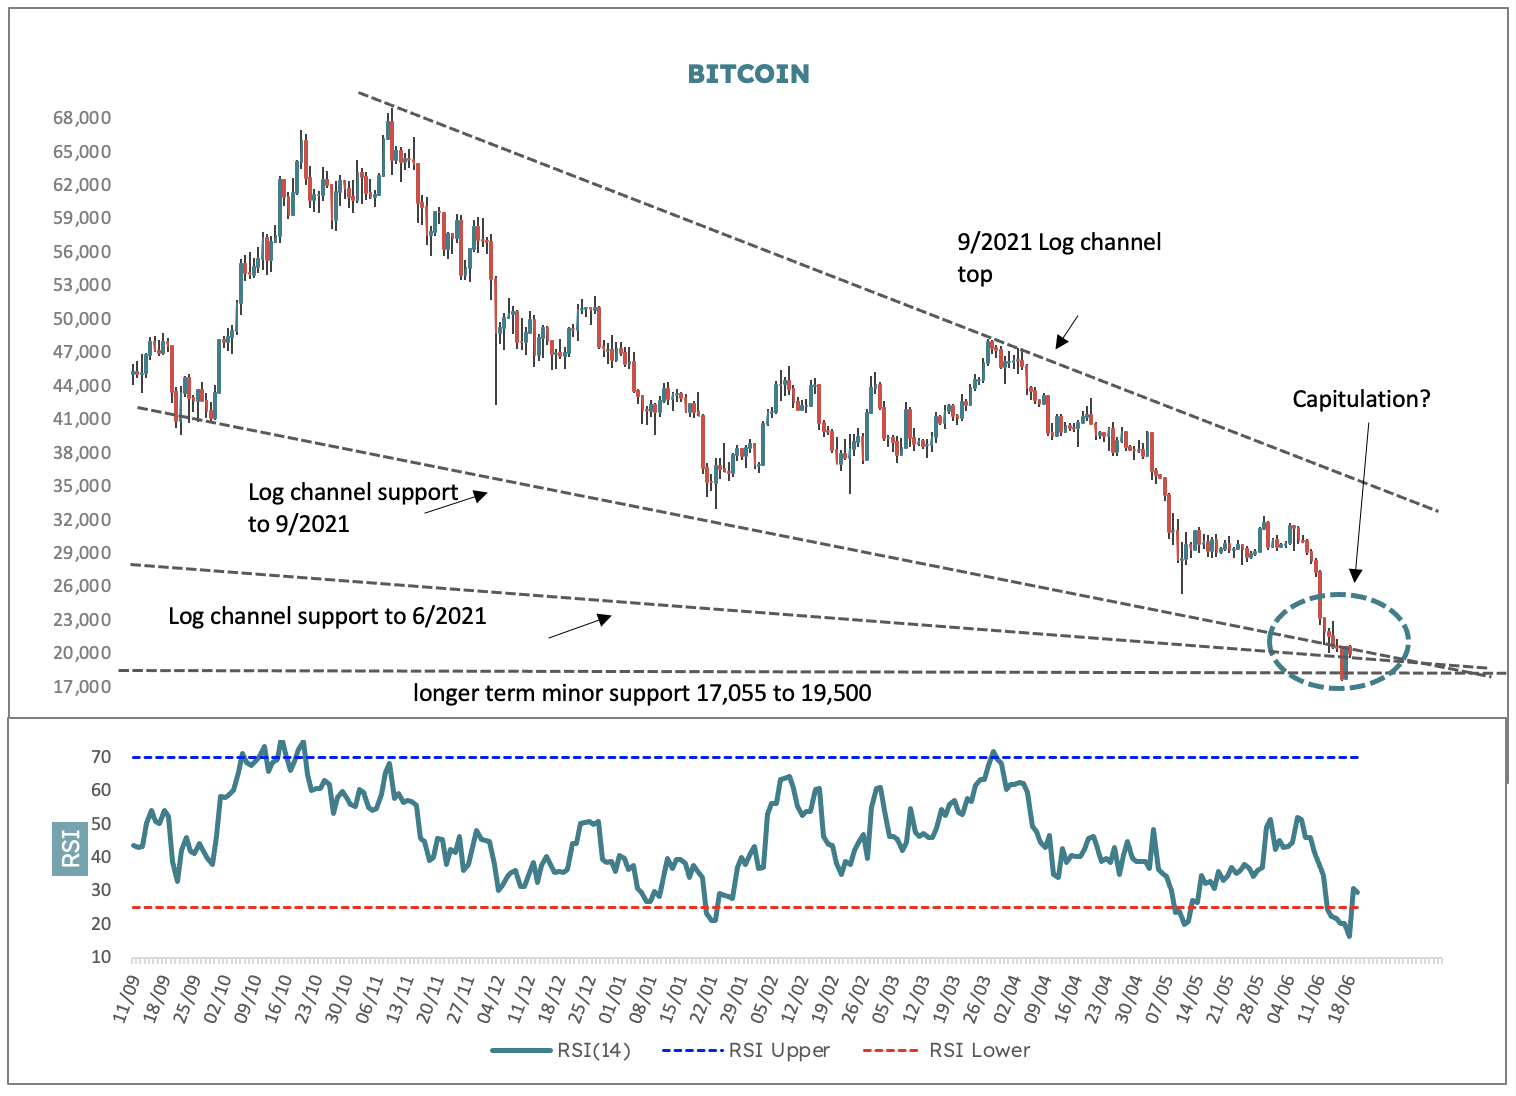
1. The intersection of two longer-term logarithmic channels tracing back to June and then September 2021.
My chart here is displayed with arithmetic scaling, which means that the price intervals are uniformly spaced (in other words, for example, the gap between US$20,000 and US$30,000 on the y-axis is the same as that between $50,000 and $60,000).
And while there are channels when the price series is set like this, the more important ones are revealed when logarithmic scaling is applied (one which increments in percentage terms).. that’s just the way the market “thinks”.
2. Price aggressively tested a shade above $17,700 on 18 June.
This corresponds to a minor but structurally important uptrend correction in November/December 2020 (between US$17,055 and US$19,500). It remains to be seen whether this deeper value recovery back above $20,000 now marks an end of decline low, but there are also two other factors to bear in mind.
3. The 14-day RSI reached down to 16 and change, a level last seen at the highly important price low of mid-March 2020.
4. Yesterday, which is a closed market for pretty much everything else apart from the Middle East, a bullish engulfing candle formed. This is where the range of that day’s up candle envelopes the entire candle of the prior day.
In this case, both of the weekend’s candles were long with Saturday hard down and Sunday hard up. This is pretty energetic stuff for a weekend and taken altogether there are some signs of downside capitulation showing through here.
With that said however, we need to see a good push out now to confirm.