Table of Contents
I thought we would look further a field than Bitcoin today to see if there is an instrument that tracks it well, but for which we can do a separate technical analysis.
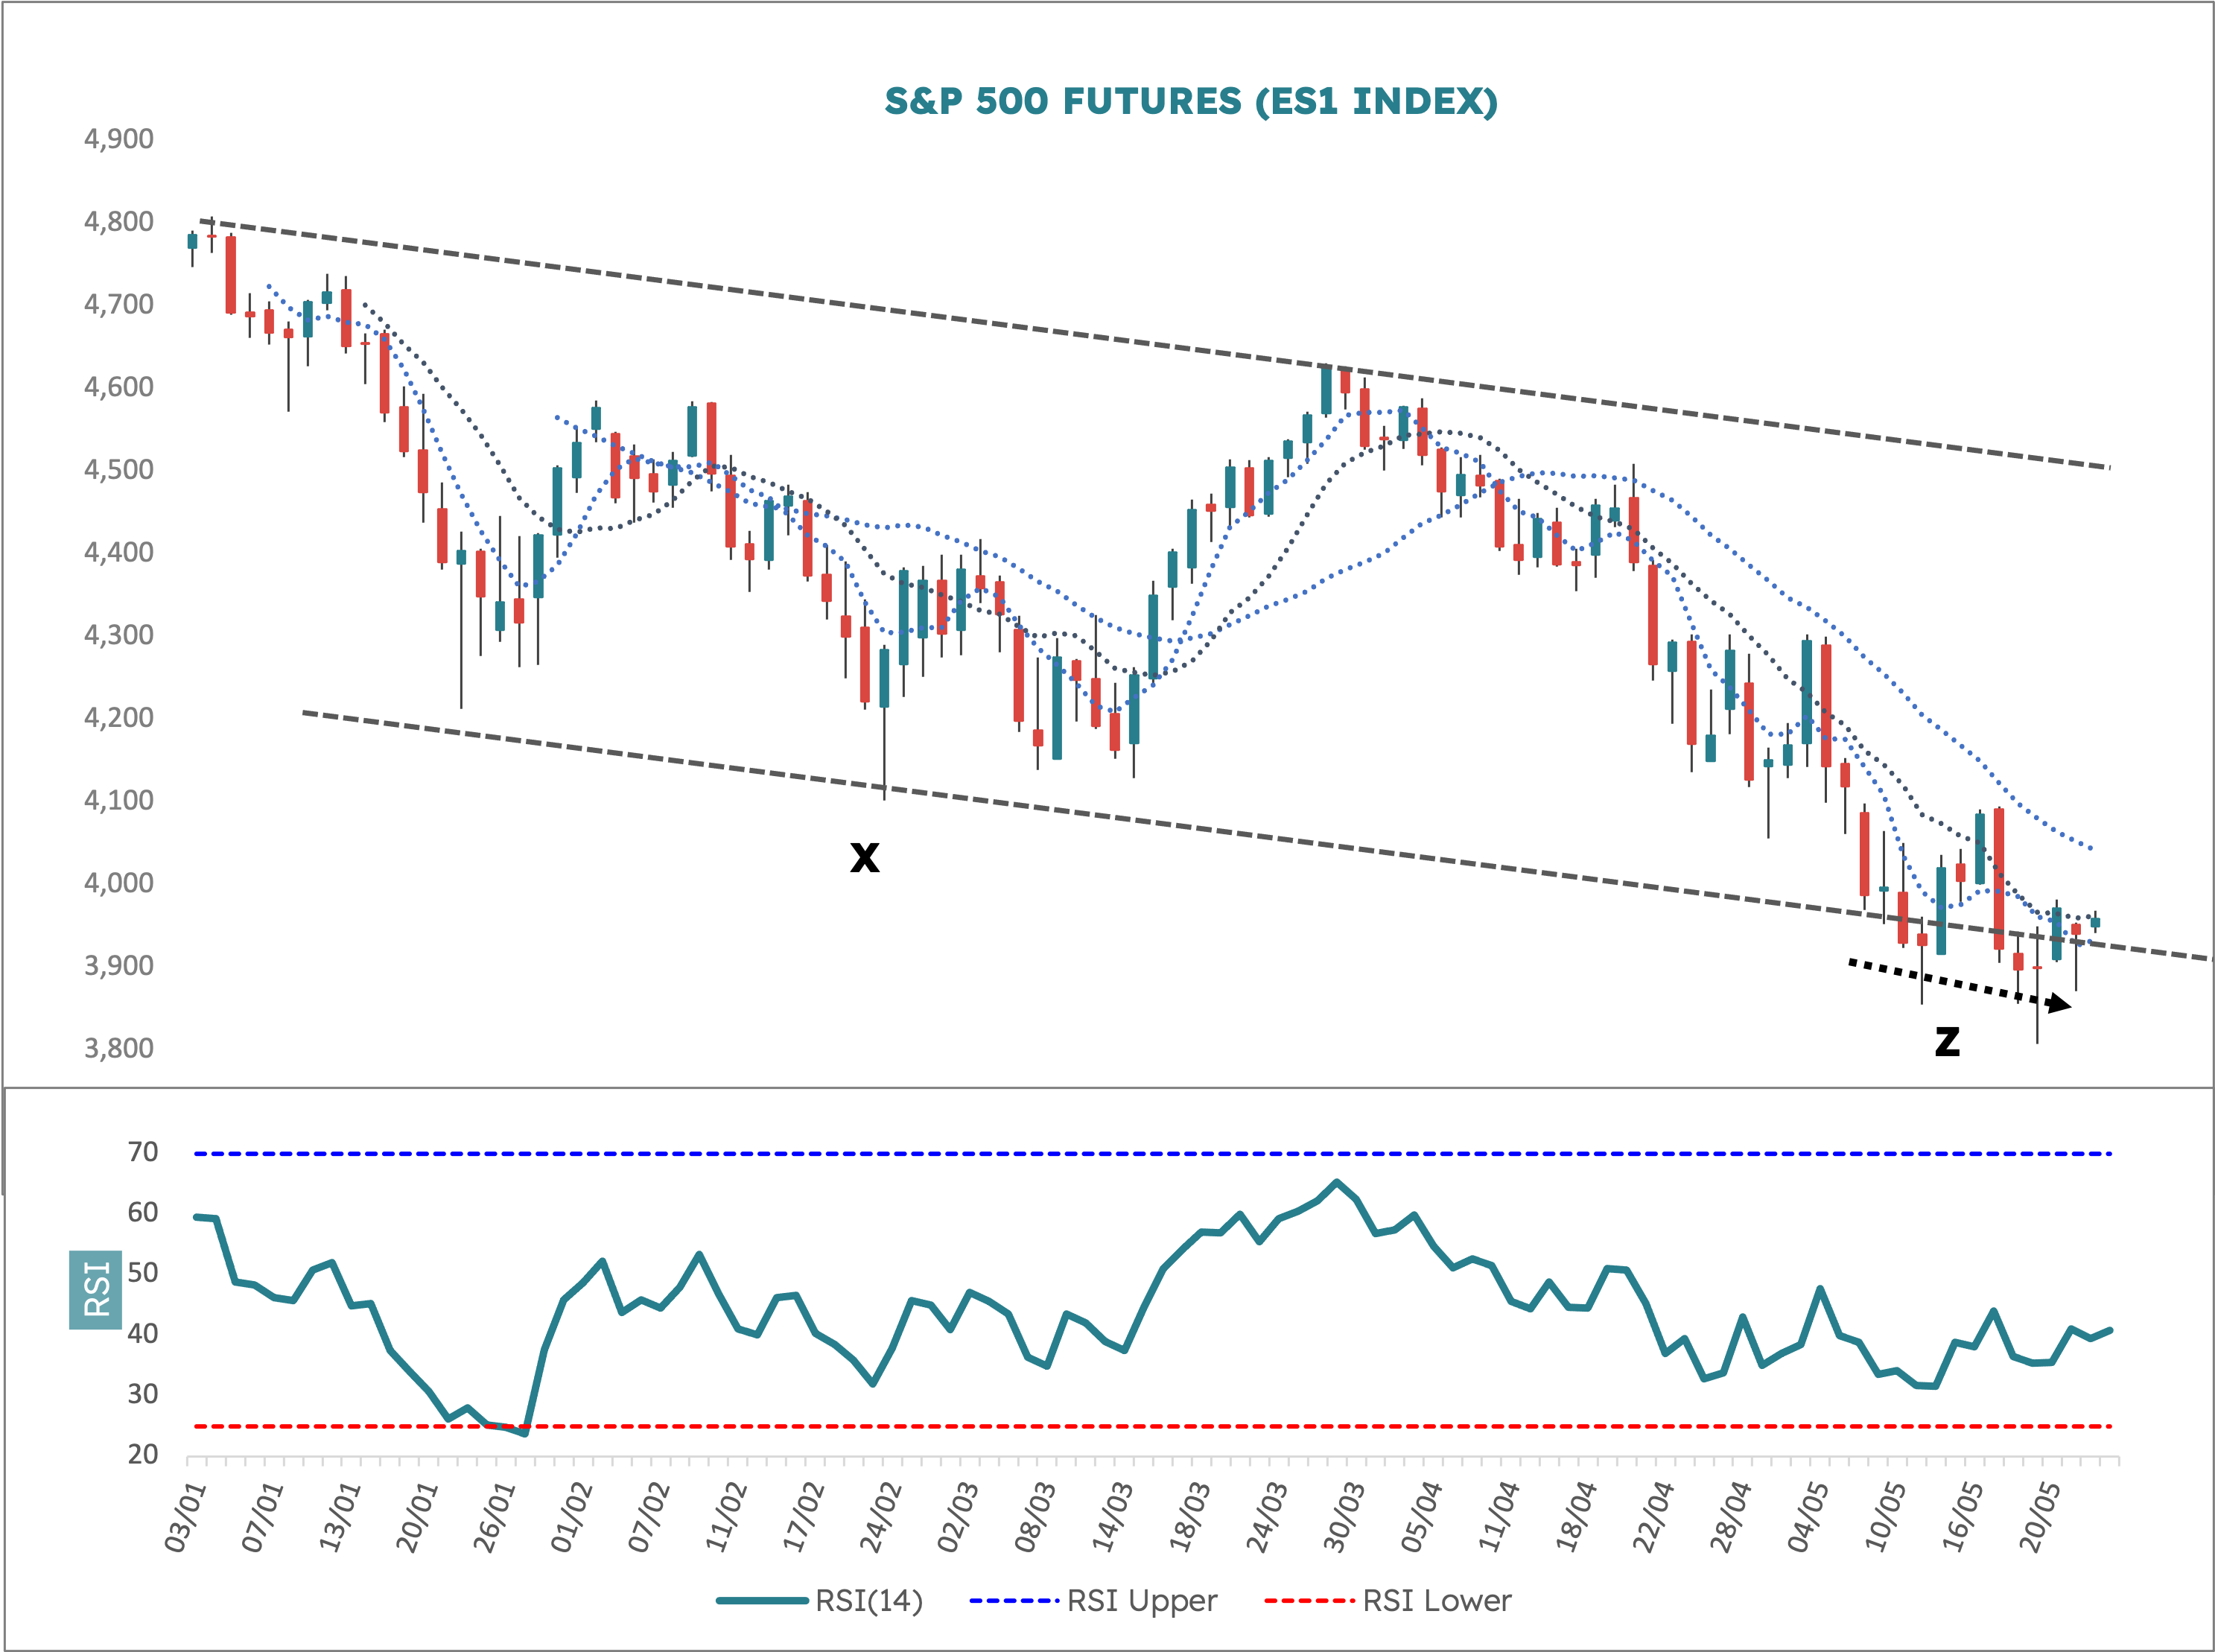
Doing a read across like this often helps clarify what may seem muddy in the main ticker of interest. To find a suitable index, I ran a correlation study of multiple indices from the start of 2022 to find out what matched up most closely. It was the ES1 Index for the S&P500 Index futures contract. The correlation is +0.86, which means the two series match very closely.
There are a few interesting things to consider in the ES1 chart. The main takeaway is that the price action within the down channel has a zig-zag down look to it. There is a big bounce midway (Y) which drives right up into the price range of the first leg down (X). This choppy structure strongly implies that there is a longer, unseen uptrend in force, and that price is working its way across this in a correction.
In other words, if the January move down is a correction, then it is going the opposite way to the main trend, which is therefore up. Typically, corrections form three distinct waves. I think there is a case to be made for the current low price structure to be the final (Z) wave. This means the whole thing could have just ended and we are due a rebound of some sort. This, by implication, should drive crypto higher.
Note also that price is at the bottom of the channel and that we are building a bullish divergence in RSI. This was covered in the first RSI teaching notes and highlights a big slow down in price, a necessary precondition for the end of a decline. We also just had our first moving average crossover to the upside.