
Note: The teaching series, spread over 12 monthly articles, aims to provide a basic to intermediate understanding on a range of topics, including momentum, volatility, moving averages, basic patterns, cycles and the Elliott Wave Theory.
In my last teaching note, published in April, we looked at six core RSI set ups: Overbought & Oversold; Bull & Bear ranges; and Bearish & Bullish divergences. In this lesson we will look at the following:
1. Negative reversals
2. Positive reversals
3. RSI head and shoulders
4. RSI support and resistance
In all of the examples, I am using daily charts and a 14 day RSI, the traditional look-back period for calculation. Note also that although RSI can be calculated from any price point during the session or a combination thereof, typically we use the closing price.
Read More: Blocksmith Explains Relative Strength Index (RSI)
Negative reversal
A Negative reversal in RSI is typically seen midway down a meaningful market pull-back and points to a downside continuation.
What happens is this: price declines sharply and then puts in a countertrend bounce (upwards in this case), drops again as stale sellers are attracted to the higher entry point, starts falling again, bounces for a second time and then collapses back into the prior downtrend. During this two-peak-bounce sequence, the closing price is higher on the first bounce than on the second and the RSI value on the first bounce is lower than that of the second bounce. In effect, the line joining the two RSI peaks is up and the line joining the two price closes is down.

A good example is Figure 1, which shows the performance of the Japanese technology sector (TPELMH Index) between January and February 2022. There is a price decline from 6 January and a short cover bounce starts on 28 January, reaching a highest close of 3,668, corresponding to RSI 42.5. Then a small pull-back and a second bounce which taps out at a close of 3,628, corresponding to RSI 44.2. Thus, the second close is lower by 1.1%, whereas the second RSI is higher by 4%.
You can think of this pattern as an exhaustion set up inasmuch as even though momentum is pushing harder, it is unable to move price higher. We could say therefore that ease of movement to the upside is impeded, which speaks to embedded downside power.
Negative reversals can be harder to spot until you get your eye in and you will not see them in every decline, but that’s the market phase you need to be looking at to find them. Also, bear in mind that you need a close below the second bounce and need to see RSI swing lower until you make the call.
Positive reversal
A positive reversal in RSI is seen when the underlying trend is up, price pulls back, and as a result, a lower than recent RSI value is posted. Price continues upwards, pulls back again in a natural refresh and even though price is higher than at the end of the first pullback, RSI is lower. This is also often referred to as a “springboard reversal.” The logic behind it is that even through RSI (momentum) weakens further it is unable to drag price down with it, pointing to embedded uptrend power.
In effect, the line joining the two RSI troughs is down and the line joining the two price closes is up. Typically there is then an RSI swing higher off the low and price is catapulted upwards.
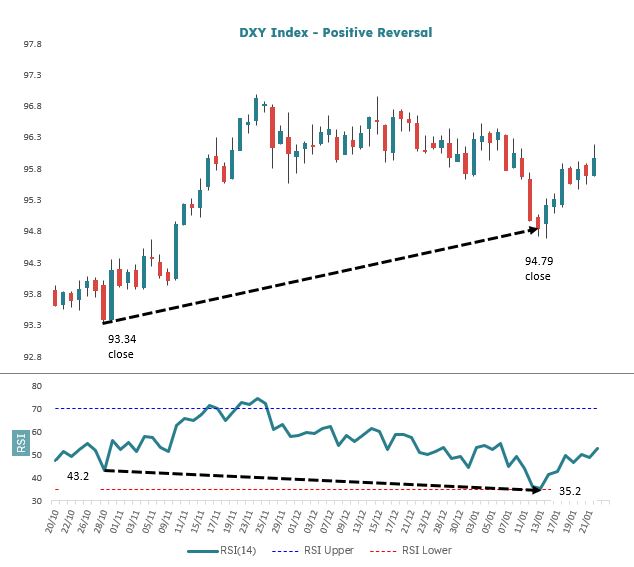
In Figure 2, we see the Dollar Index (DXY) between the end of October 2021 and mid-January 2022. There is an underlying uptrend, and on 28 October 2022, the price finishes a shallow refresh at 93.34, with RSI hitting 43.2. The price then rebounds and continues higher and then undergoes a steeper pullback, which ends 13 January 2022 at a close of 94.79 with RSI at 35.2. Thus over the sequence, RSI drops by nearly 19%, but the price rises 1.6% and then rallies again.
Head & Shoulders Top
Recognised technical price patterns also occur in RSI, which itself is just a derivative of price. These RSI patterns tend to lead price and are therefore well worth being acquainted with. A standard head and shoulders top in price is where the price runs up and pulls back sharply, potentially forming the first shoulder.
There is then another run up ,which tops out potentially forming the head. The price then pulls back and then rallies again but not as high as the head and then fails and starts declining quickly, thus forming the second shoulder of the head and shoulders pattern. (Note: there needs to be a decent uptrend into the first shoulder for the pattern to actually qualify as a head and shoulders.)
The exact same pattern also occurs in RSI but usefully often not when price is doing the same. This means that innocuous looking price action can be revealed as having weak underpinnings if an RSI head shoulders completes beneath the surface.
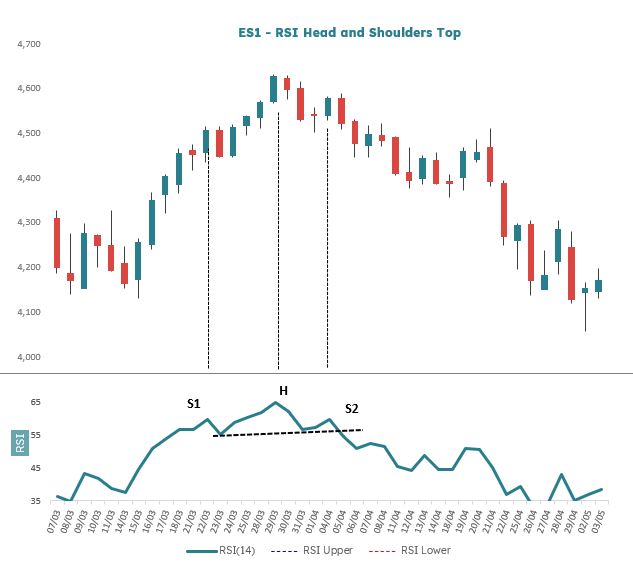
Figure 3 shows the S&P500 Eminis futures contract (ES1 Index) between March and early May 2022. Its price rallies well from 15 March to to 29 March, pulls back for three sessions and then looks to start up again. It’s not obvious at first glance that there is a major threat. RSI meanwhile posts a clear head and shoulders top indicating that all is not well beneath the surface. The head and shoulders completes as the neckline is breached to the downside and price goes on to decline by 10% over the month.
Support & Resistance
Just as we see support and resistance in price charts, we see the same in RSI and this can help us gain more insight into what is happening in the actual price chart. Broadly speaking a support level (a barrier which holds price from below) tends to become resistance (a barrier that prevents price form rising) in future time once it has been broken through, and vice versa, resistance will become support. Support and resistance is a big topic, so we are going to limit ourselves to a not untypical RSI sequence, where the two levels reverse roles and then examine what we tend to see happen to price.

Figure 4 is Crude Oil futures (CO1 Comdty) from August to December 2021. Price drifts sideways through August to mid September and RSI is capped by resistance (red down arrow) around 55. The price then breaks higher and pulls back, but notice that prior RSI resistance has now become support (blue up arrow), this is the Buy signal.
Moving on to early November now, price pulls back and RSI support is broken, there is a rally and price looks benign enough, but notice that RSI support now reverses roles to resistance again and price enters a precipitous decline.


)