Table of Contents
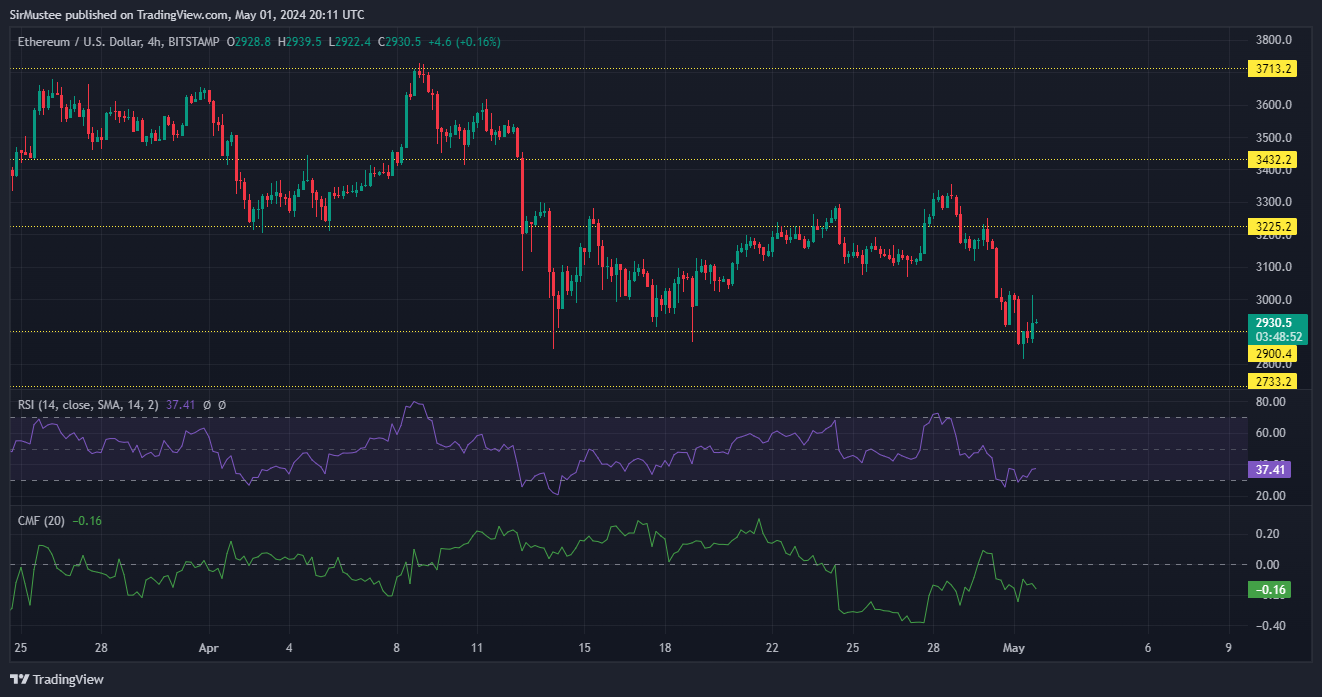
ETH buyers showed signs of life with a bullish candle close at the $2.9k support level over the past 12 hours. This came after Ethereum recorded a 5% dip within the same period, dropping from $3k to $2.85k.
This bullish push from the $2.9k support level could spark a buying frenzy and the movement of this critical chart indicator suggests bulls could be preparing to rally again.
Buyers Remain Active on ETH
ETH hasn’t been spared from the bearish sentiment in the market. The top altcoin has seen its value drop by close to 15% over the past three days. However, the bullish price action at $2.9k signaled that buyers were looking to halt the selling pressure.

The bullish candle close from $2.9k briefly touched $3k before closing at $2.93k. Interested buyers from this level can look at the positive signal from the Relative Strength Index (RSI).
The RSI which measures the strength of a given price trend rebounded swiftly from the undersold zone, based on the bullish candle close. Albeit, it still remained under the neutral 50, this delivered a timely reminder of the buying strength available at the level.
Buyers can target profit levels at $3.1k to $3.2k. It is advisable to aim for short term profits, due to the overall market sentiment and potential for increased volatility.

While the spot market displayed some hope for buyers, margins remained tight in the futures market. Data from Coinglass showed that longs narrowly edged shorts on the four-hour timeframe.
This could potentially have a positive or negative impact on the spot price movement, if the price momentum on the lower timeframes swings in the favour of shorts.
Disclaimer: This article does not constitute trading, investment, financial, or other types of advice. It is solely the writer’s opinion. Please conduct your due diligence before making any trading or investment decisions.


