Table of Contents

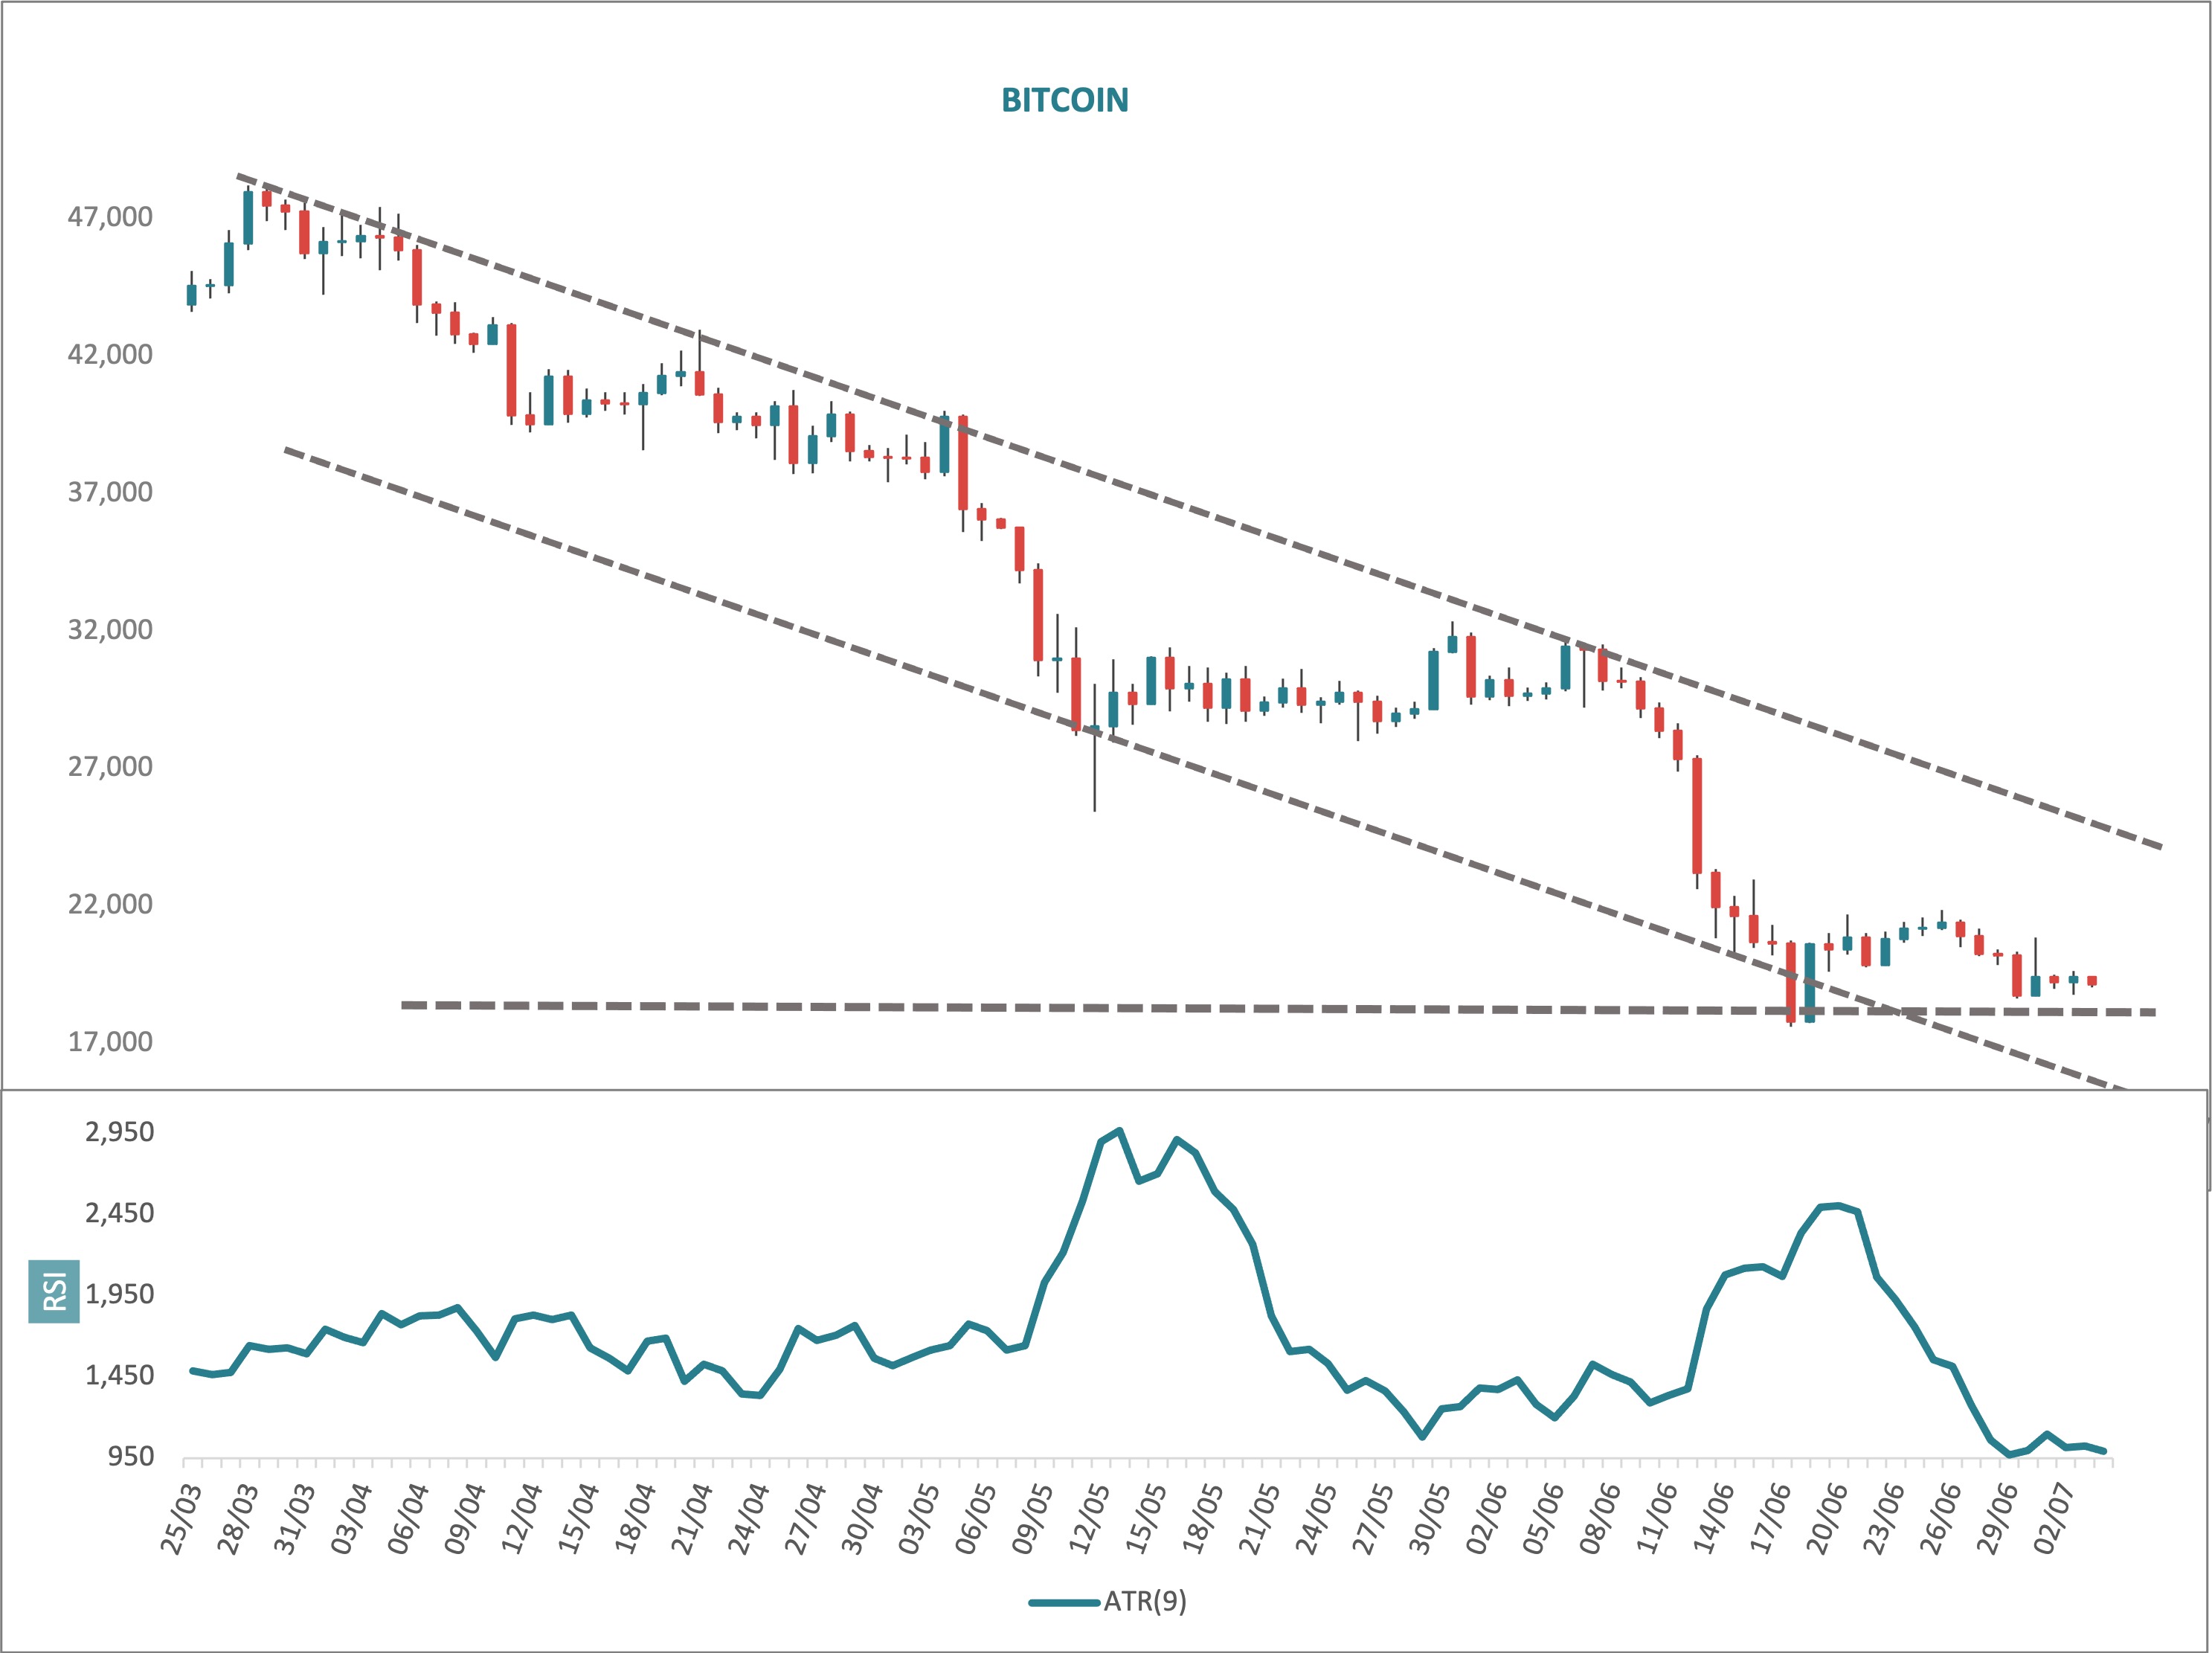
Bitcoin’s US$17,600 low on 18 June corresponds more or less precisely to a range low within a month long sideways uptrend congestion period back between mid November and mid-December 2020. Its price has been above this level ever since.
There are many different methods to establish potential downside targets, but one is to look for meaningful pauses in the uptrend that preceded the downside correction.
It is my working hypothesis that the entire down-up-down long zig-zag style sequence (from the end of the March 2020 uptrend that occurred mid-April 2021) is a correction and that price is currently in the latter stages of the final wave down. In this sense it makes sense to look back at that March 2020 to April 2021 upswing for possible stopping points to the current decline. And as pointed to in the first paragraph, US$17,600 is a candidate.
There is a market dictum that says that low volatility precedes high volatility. Now on its own you can’t just pick a low volatility phase and immediately say with any confidence that a high volatility regime must therefore follow. But when there are a constellation of clues, you can start building a more robust case.
One measure of volatility which we have discussed in previous notes is average true range (ATR). This simply looks at where price sits within a formula of highs and lows over a prescribed look back period and describes how much or little price is moving around. And interestingly, 9-day ATR on 29 June 2022 hit a low of 971. It has risen to 992 in the current session, but we last saw these low levels back in mid-December 2020 just ahead of the final huge push up in the advance that began in March 2020 and out of that Nov-Dec congestion phase.
So we are back at that theoretically important congestion area both in terms of price and volatility. Additionally, as I pointed out last week, the significant bullish engulfing candle that marked the 18/19 June low is a natural barrier.


